Need a web developer?
Tight deadline? Technical questions? Tricky problems? Demanding project?
Don't worry, I'm here to help. I work with leading marketing agencies, established companies and start-ups to help with the development of their websites and web applications. No problem is too challenging, no project is too big. How can I help you?
What do I do?
I specialize in website development, with a focus on Craft CMS and Laravel PHP projects. With over twenty years of experience, I have a multitude of tools at my disposal to get your website built on time and within budget. My technical skills include PHP (Craft and Laravel), Javascript (Vanilla, AlpineJS, Vue), and CSS (Vanilla, TailwindCss).
With time and experience, I have gained valuable knowledge in website architecture and development, frontend and backend coding, mobile optimization and integrating with APIs. I would be happy to chat about how I can help get your project completed. Click here to get in touch.
How does it get done?
People look at a website and see what's right in front of them, some images and text, maybe some interesting animations. On the surface a website seems pretty simple but it you peel back the layers there's a lot of complexity hiding under that polished screen. Layers of design, lines of code, megabytes of information, and streams of data. It all needs to be crafted together into a glossy, intriguing and engaging website.
What have I done?
Over the last twenty years I have been able to work with amazing teams and clients on some great projects. Each project has been unique, some big, some small, some easy, some challenging, but the end result is always a happy client and a great website. A few of my favorite projects and featured below. If you want to see more click here.
How long have I been at it?
Fifteen years freelancing and over twenty as a developer. I have seen a lot, learned a lot and done a lot, but every day brings a new challenge and a new opportunity. Here's a few career highlights.
2006 Sink or Swim
After a few years of working in the corporate world I decided to take the dive and go full time into freelancing. I had no idea what was ahead but I knew I needed a change from the corporate grind. What a ride it has been.
2009 Beam me up Scotty!
As a life long Star Trek fan (William Shatner was the best Kirk) I didn't think twice when Project C and Paramount Studios asked for help on a photo mosaic photo booth to help promote the Star Trek movie. I never expected a little side project like my photo mosaic generator would get noticed by Hollywood.
2012 Do I get a medal?
It's not every day you get to work on an Olympic sized project. NBC needed help managing and distributing the digital material for the 2012 London Summer Olympics to their partners and internal teams. Gotham and All Kinds gave me the call and I got the chance to shine on the Olympic stage. Talk about deadline pressure ... not being ready on July 27, 2012 was not an option.
2017 Google who?
Sometimes lightning hits the same spot twice. I was fortunate to work with the awesome team @ This Is Grow on a project for Google. Not long after that project wrapped up Youtube came knocking with a project they needed help with. Working with developers from Google was a little scary at first. Was I good enough, did I know enough? Turns out I did.
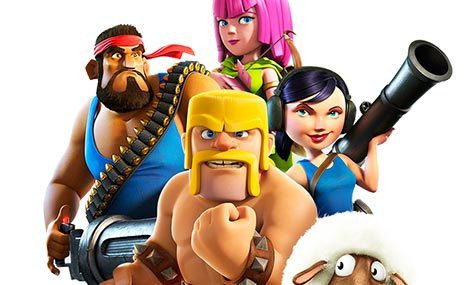
2019 Ready to rumble?
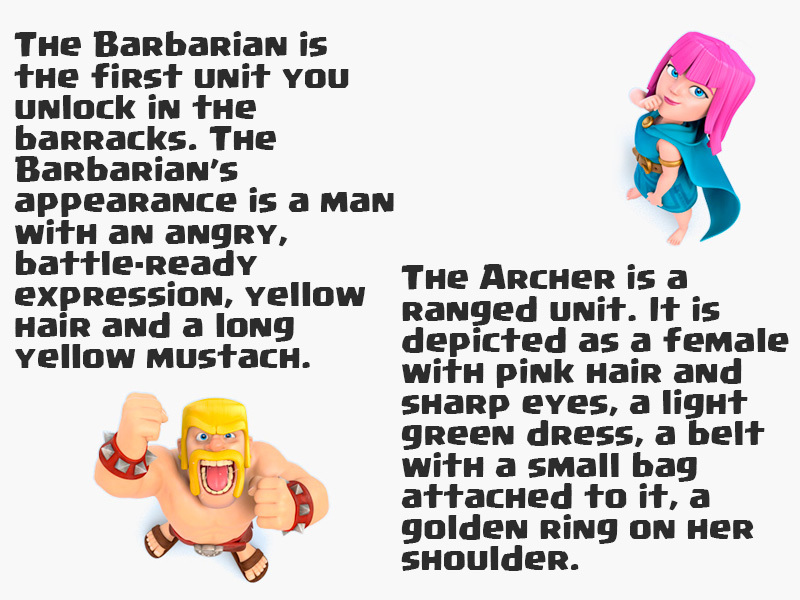
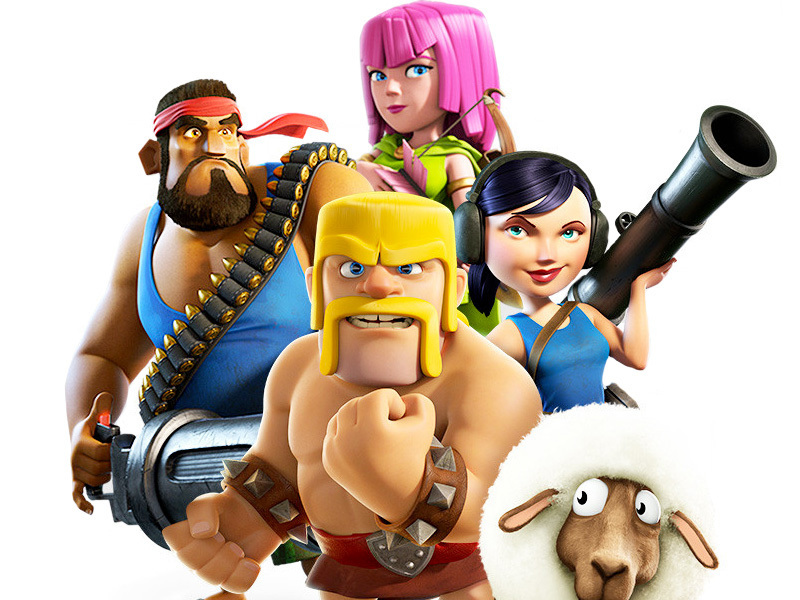
I think this was more exciting for my kids. The crew @ FirstBorn needed some heavy duty Craft help with the family of Supercell sites for web and in app content management. Getting to work Clash of Clans, Boom Beach, Clash Royale and Hay Day was great but working with the team @ FirstBorn was even better. Insanely creative people with technical chops and a passion to make great stuff. One of my favourite projects to work on.

2023 10 year anniversary 🎉
Back in 2013 I decided to build and launch a side project called PageProofer. I was frustrated with getting flooded with feedback spreadsheets and bug report emails while building websites. The idea was pretty simple, add sticky notes to websites and streamline the back and forth feedback. It took all my knowledge in frontend, backend and dev ops to pull it off. Turns out a lot of people found it useful and ten years later it is still going strong.

🤔 What's next?
Honestly, I have no idea. Hopefully more problems to solve and more great people to work with. Freelancing is a crazy ride with lots of ups and down. Every day is a chance to learn and experience something new.
Looking back on everything, it's been a blessing to experience and learn so much in 15 plus years. I have worked with some amazingly talented people and pushed myself farther than I thought possible. What is the biggest takeaway? GRATITUDE!
Who have I worked with?
I have been fortunate to work with many award winning agencies and top brands. They trust my ability to deliver successful projects, to work alongside them with integrity and to uphold their high standards. Get in touch if you would like to talk about your project.


Why would you want to work with me?
Well, besides the fact my wife says I'm pretty special, here are five great reasons.
1. Get In, Get Out
Define a mission. Get in. Get it done. Get out. I like to set clearly defined parameters and goals for a project and then deliver ...

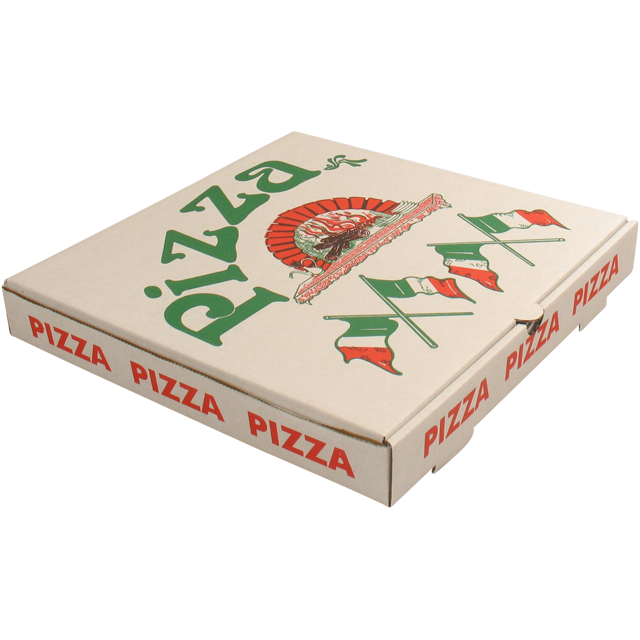
2. I love to deliver
Who doesn't love it when the pizza man shows up at the door with a fresh, hot pizza. Being able to deliver a project on time and on budget is one of the most rewarding things I get to do. I don't have a 30 minutes or it's free policy though 😥.
3. I have a curious mind
I love a challenge and coming up with creative solutions. The best part of being a developer is the problem solving. Think about it, break it down, and then start solving. Some of the best projects I have worked on presented the toughest problems.

4. Pressure makes diamonds
I have worked on plenty of high pressure, high demand, tight deadline, large scale projects. The gold medal for high pressure, tight deadline projects that I have worked on goes to the 2012 Olympics media site. I'm comfortable working in an environment that presents pressure situations.

5. My sense of humour
I don't take myself too seriously. This website is exhibit A. It's not your classic boring developer site.

How to contact me?
Whether you're in New York, Los Angeles, Chicago, Miami, San Francisco, Toronto, Vancouver or somewhere in between, if you have an interesting project and need help, let's chat.
Send me a message or you can call me @ 905.251.0319.
Your messsage has been sent.
I will be in touch soon.